Office building at dusk with lit windows

Energy monitoring for commercial buildings

One kilowatt hour in three does nothing useful.

Lumio connects the electricity and heat meters you already have, shows usage hour by hour and alerts you when something draws energy for no reason. No rebuild, no new meters.

Used by facility teams at

  • Kvarnbacka
  • Ravelund
  • Malmhed
  • Hedemark
  • FJÄLLSJÖ
  • GRÅNÄS

Why doesn’t the waste show up on the monthly bill?

Most organisations follow their energy use through a single number a month. That tells you about as much as running your finances on the year’s combined bank statement.

Ventilation that runs all night, lights that are never switched off and heating in empty rooms all disappear into one lump sum. A building that wastes 15 percent every night looks perfectly normal at monthly level.

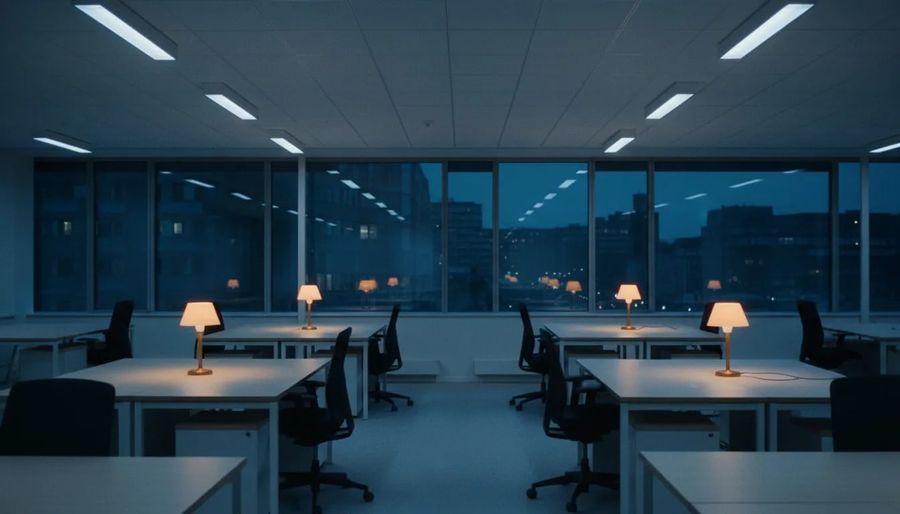
Empty open-plan office in the middle of the night with the lights on
  • Idle running at night

    Anything drawing power at 3 am on an ordinary Tuesday does so without anyone asking for it. In connected buildings, 38 percent of night-time use has no operational reason.

  • Ventilation after closing time

    The most common single fault is a broken or misconfigured schedule: 44 percent of all anomalies the platform alerts on.

  • Heated empty spaces

    Premises that have stood empty for months keep being heated because nobody sees it. The faults are cheap per night and expensive per year.

What does a day look like, hour by hour?

Required base load

02:14Ventilation running

Air handler TA3 started without a schedule and ran for four hours. 38 kWh for no reason.

02:14Ventilation running

Air handler TA3 started without a schedule and ran for four hours. 38 kWh for no reason.

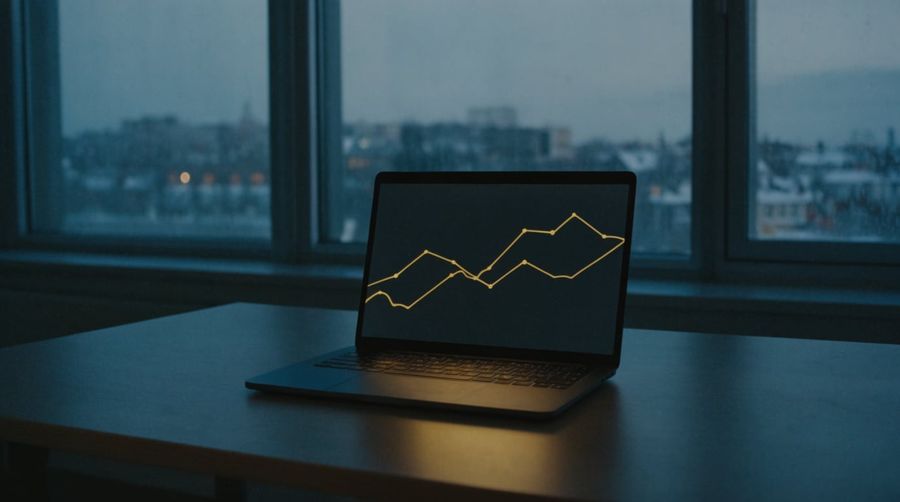
Sample data from a fictional 8,400 square metre office building. Hover over the points on the curve.

  • 12.5%of the electricity in connected buildings is pure idle running
  • SEK 118,000wasted per year in the median building
  • 214buildings connected to the platform

How do you go from a monthly bill to hourly data?

  • Measure where decisions are made

    We connect the main meter and add sub-meters on ventilation, heating and other large loads. Done in a couple of days per building.

  • Teach the system what normal looks like

    After two to four weeks the model has a baseline per metering point: how the building behaves on an ordinary Tuesday, a weekend, a public holiday. Adjusted for outdoor temperature and opening hours.

  • Act on anomalies, not on reports

    When a curve breaks its pattern, an alert goes to the person who can fix it, with the metering point, the time and a suggested fix.

We thought we had it under control because the bill looked like last year’s. In the first week of hourly data we found a garage fan that had been running around the clock since 2023. It never showed, because it had always been on.
Maria Lindqvist, facility manager, Vasapark Fastigheter (fictional)
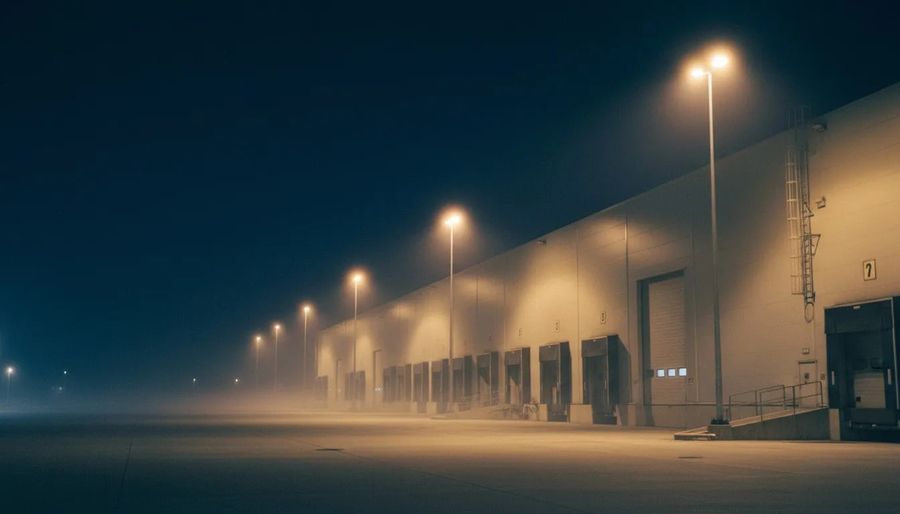
Logistics terminal at night in fog, loading doors closed and lights on

How did Norrpil Logistik switch off the night in three terminals?

The night level was 47 percent of the daytime load and nobody could say why. Six months later: 24 percent, and an electricity bill SEK 410,000 lower per year.

From the blog

See your own kind of premises in the platform

The demo takes 30 minutes. We show hourly data, baseline and alerts based on your kind of business, and what connecting would mean for you.

No newsletters, no sales lists. The form is a mock-up on a demo site and sends nothing.